|
|
| data... any distance... minimal time |
Introducing the VFP DebuggerBy Colin Nicholls This article was first published as session notes at the Microsoft/Advisor Visual Foxpro DevCon 10 in May 1999. IntroductionIn version 5.0 of Visual FoxPro, the lame Debug and Trace windows of 3.0 (and earlier versions) were completely replaced with a brand-new suite of powerful debug windows. In the latest version, 6.0, not much has changed. They are still powerful, and most of us are still unfamiliar with the full range of features that they offer. In these notes, I shall demonstrate these features in depth. Hopefully there will be something new in here for each of you, including those of you who have been using the Debugger extensively since 5.0. How to activate the DebuggerThere are a number of ways to launch the Debugger from inside Visual FoxPro. Perhaps the most common way is to select Debugger from the Tools menu:
There are other ways. Try typing any of the following statements in the Command widow:
              debug

              set step on

              set echo on

              activate window debug | trace | locals | call
The Debugger appears, and if you’ve never seen it before, I can imagine it startling you by its size and complexity. Where do you start? What do all these nested windows do? It has a menu and a toolbar and everything!
It can look daunting at first. To gradually introduce ourselves to the capabilities of this tool, let’s first set a simple preference that will simplify things for us: Select Tools:Options, and select the Debug page. By changing the Debug environment preference from “Debug Frame” to “FoxPro Frame”, we simplify the number of windows we have to look at, and makes the Debugger behave a little more like as it used to.
Click OK to save your change, and now look at the Tools menu again. It’s changed to include a separate menu item for each of the Debug windows. In-depth TourThere is more than one Debug window now. Let’s look at each window in turn. The Trace windowUse the statement ACTIVATE WINDOW TRACE to bring up the trace window. The Debugger ToolbarThe first thing you notice when the trace window activates is that the Debugger toolbar also appears.
The Debugger toolbar is the “control panel” of the VFP Debugger. Using the buttons on this toolbar we can control code execution in step mode; hide and show any of the Debug windows; and enable or disable breakpoints, coverage logging, and event logging. Here are the ones that are specific to the Trace window:
Unless you are currently running the program, the Trace will be empty. You can rectify that by clicking on the Open button of the Debugger toolbar, and select a program to run. (Try RUNACTD.PRG in the VFP6 directory.) The code is shown with the same colored syntax that the editor uses.
The two combo controls at the top of the window allow you to look at other methods in the current object, and the methods of any member objects. Note: These are not necessarily methods in the current Call Stack (although they may happen to be in the calling chain) but just other source code in the current module. Something I didn’t notice until it was pointed out to me recently is that you can use the keyboard to manipulate these controls by moving the focus using the Alt-B and Alt-R key combinations (see the underline hotkey on the labels?). Each Debug window has a different right-click menu, with options on it that are specific to the context of the window. That’s why they are also known as “context menus”.
What is “Docking View”?One option on the context menu that appears to make no sense at all is Docking View. If you select it, a tick mark toggles next to the menu item, but no other obvious effects are apparent. What it does is enable the window to be docked, like a toolbar. If you double-click the title bar, or drag the window near the borders of the main FoxPro window, you can “dock” the trace window so that it becomes part of the FoxPro frame. All of the Debug windows support this docking view, but don’t get carried away: you can easily lose windows while trying to get them all docked neatly, and these windows don’t always have a lot of border space to click and drag on in order un-dock them again. In my experience, docking view is rarely useful. Step ModeYou can step through the program using the Trace window context menu, if you are addicted to that right-click-drag motion, but the rest of us will probably prefer to use the code execution controls on the Debugger toolbar, or their function key equivalents:
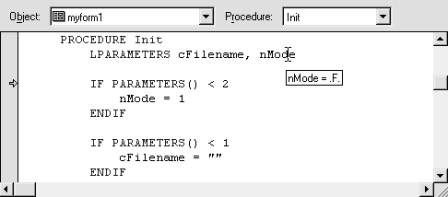
You can get a table of Debugger shortcut keys by looking up “Debugger keyboard shortcuts” in the VFP help file, but to save you the pleasure of loading up FOXHELP.CHM, I’ve included them in these session notes. (Note: Jim Saunders has pointed out on the newsgroup that if you assign a macro to these keys, they will no longer work as keyboard shortcuts in the Debugger window. ) Here’s something to watch out for when using Run To Cursor: If the cursor is on a line of code that would not normally be executed due to conditions not being met, and you resume, the program will not suspend but will continue past the line indicated by the cursor and not stop until another breakpoint condition is met. Tool-Tip value exposureAs the following picture shows, one very exciting feature of the Trace window is that if you place the cursor over a variable or fieldname, its current value is exposed via a tool tip:
However: this does not work for #define expressions, or for values in modules other that the currently executing procedure or method. When you are stepping through a running a program, a little yellow arrow points to the next line of code to be executed. When you are looking at a method or procedure which is higher up in the calling stack, the current line of code in that method is indicated by a black triangle, as shown here:
Drag code to the Command windowThe Trace window is a drag source: For example you can highlight a section of code, drag and drop it on the command window for execution there. TIP: While you are tracing, you can also use THIS and THISFORM in the Command window! Trace between breaks & the ThrottleNormally, when you Resume, Run to cursor, or Step out, the Trace window stays static while the code execution continues. By turning on “Trace between breaks” you can watch the code execute line by line automatically in the Trace window. You can set the delay between statement execution by selecting “Throttle” from the context menu and setting a value in seconds in the resulting dialog:
WARNING: Before you turn on Trace between breaks – especially with a non-zero throttle setting – and then Resume, ensure that you have SET ESCAPE ON. Otherwise your program will inexorably step its way line by line to the next wait state in your application – even if it takes hours. If you have SET ESCAPE OFF somewhere in your program (which most of us do) then you are in trouble. Alternatively, set a breakpoint somewhere downstream in your code that will ensure that your program suspends. Which brings us to… Setting breakpointsA breakpoint is a condition upon which the program will suspend execution. The easiest way to set a breakpoint at a specific line of code is to double-click in the shaded area to the left of the code. Breakpoints can be Enabled or Disabled, as we’ll see shortly. The following picture shows code with two breakpoints set. The filled dot indicates an active breakpoint, and the transparent dot indicates an inactive breakpoint.
You can also set a breakpoint at the current line of code by pressing the Toggle Breakpoint button on the Debug toolbar. TIP: You can also use the Set Breakpoint option on the right-click menu in the design-time source edit windows to set a breakpoint on the line of code that the cursor is located on. WARNING: Breakpoints only work if the line of code is actually executed. Your program will continue to run regardless if the breakpoint is in a block of code that is not executed. Where do these breakpoints go? Is there a place where we can see all the current breakpoints? There is a place, and it is also another, more powerful place to set breakpoints - the Breakpoints Dialog:
The Breakpoints DialogYou can display the modal Breakpoints Dialog by clicking on the Debug toolbar button that looks like a “Stop all windows” road sign. (See “The Debugger Toolbar” above.) As far as I know, this is the only way to display the Breakpoints dialog when you are working in the FoxPro frame. There are three buttons on the Debugger toolbar that are specific to breakpoints:
Here, the currently defined breakpoints can be individually enabled or disabled, or removed entirely. The “Clear All” button is functionally equivalent to the button on the Debug toolbar with the hand with the “X” – only here, if you decided you didn’t want to clear all the breakpoint definitions, you can click Cancel to undo the action. The toolbar button, however, is relentless and unforgiving. NOTE: Executing a CLEAR ALL in the Command window does not clear these breakpoint definitions. There are four types of breakpoint that the Breakpoints dialog can create. Let’s look at each of them in turn: Break at locationThis is equivalent to placing a breakpoint on a specific line of code in the Trace window or Editor window. The only drawback of setting breakpoints in this dialog is the awkward syntax required: you have to type the name of the method, the line number, and the name of the file, in two different data entry fields:
However – and this is something I didn’t realise until recently - the Breakpoints dialog additionally allows us to specify how many times the line of code executes before suspending – this is invaluable for Debugging loop structures, where the problem only occurs after a certain number of passes through the loop:
Break at location if expression is trueAs a variation on the “break at location” type, the Breakpoints dialog offers a “Break at location if expression is true” type. This allows us to add a logical condition that must be true in order for the program to suspend:
Break when expression is trueAnother breakpoint type available in the Breakpoints dialog is “break when expression is true”. This type of breakpoint will apply to any program, rather than a specific source module as in the previous two types.
Break when expression has changedThe fourth type of breakpoint can be set outside of the Breakpoints dialog, as we’ll see a little later. The breakpoint takes the form of an expression, and when the expression evaluates to a different value, the program suspends.
In practice, I set breakpoints using the easy methods in the Watch, Trace or Editor windows, and only go to the Breakpoint dialog if I need to inactivate them or augment them by adding a pass count or logical expression to the breakpoint definition. The Locals window
The Locals window can be displayed by selecting “Locals” from the Tools menu; by ACTIVATE WINDOW LOCALS; or, if the Debug toolbar is visible, by pressing the Locals checkbutton:
The Locals window is best explained by describing it as a variable watch window with every variable currently in scope automatically displayed. There are resizeable columns for variable name, value, and data type. Despite its name, it is not just for variables defined as LOCAL. Because the window shows every variable currently in scope, PRIVATE and PUBLIC variables also show up – including unexpected ones that you forgot to declare LOCAL and therefore are PRIVATE. The combo list at the top of the window allows us to select any procedure in the current call stack. The variable list updates and refreshes as we move up and down the stack. In fact, sometimes you have to do this, just to get the variable list to refresh correctly! It can be reticent at times. Change the font, ‘cause I can’t read itIf you’re like me, at the end of a hard day’s coding the MS Sans Serif 8 text in the Debug windows can get pretty difficult to read. Luckily, we don’t have to put up with this. We just use the right-click menu to change the font:
Variable type filteringThe context menu items here allow selective filtering of what types of variables are shown in the Locals window. Take this code for example:
     c1 = “Standard”
     LOCAL c2
     c2 = “Local”
     PRIVATE c3
     c3 = “Private”
     PUBLIC c4
     c4 = “Public”
     oForm = CREATEOBJECT(“form”)
After this code executes, let’s see what effect changing the variable filtering settings have:
These three screenshots show the effect of three different variable filter settings on what the Locals window displays. There are couple of interesting things to note:
Variable value editingOne extremely useful feature of the Locals window is the ability to edit the value of a variable directly. Double-click in the value column and edit the value. The picture below shows me changing the caption of the form directly in the Locals window:
This picture shows a variable containing an object reference. You can drill down expanding nested member objects recursively, showing property values of each object. You can also do this with arrays, to show each individual array element value. TIP: You can switch to or hide/show any of the Debug windows by right-clicking on the title bar of one of them:
Let’s go to the Watch window next. The Watch windowThe Watch window can be displayed by selecting “Watch” from the Tools menu; by ACTIVATE WINDOW WATCH; or, if the Debug toolbar is visible, by pressing the Watch checkbutton:
The Watch window is similar in appearance to the Locals window, except that instead of a procedure selector, a text-entry region allows you to type in any expression you want to track. It has three re-sizeable columns: Expression (erroneously captioned “Name”); Value; and Type.
As your code executes line by line, any expressions that change their value are highlighted, by default in red Dragging expressions to the Watch windowOne way of getting expressions into the Watch window is to drag one from somewhere else. Here is a simulation of a variable being dropped from the Trace window:
You can also highlight and drag expressions from the Locals window or the Command window. Variable Value editing & Expression editingAs in the Locals window (described above) you can edit values of variables directly in the Watch window. The Watch window additionally allows you to edit the watch expression: By double-clicking on an expression in the Name column, you can edit it so that a different expression is “watched”:
Setting breakpointsJust as we saw in the Trace window above, you can set a breakpoint by double-clicking in the grey margin area to the left of an expression. The red dot indicates that a breakpoint is set. When the expression next changes value, the program execution will suspend. The equivalent breakpoint type is “Break when expression changes”. WARNING: Here’s a “gotcha” related to me by my good friend Matt Peirse: If you have an existing breakpoint on an expression in the Watch window, and you revise the expression to be different (as described above), then the Watch window will show the new expression, with the breakpoint. However, the Breakpoints dialog will reveal that now, both the original expression and the revised one have breakpoints set and active. RELATED WARNING: Just because you can’t see any red dots in the Watch window or the Trace window doesn’t mean there aren’t any active. The Breakpoints dialog accumulates them and won’t release them until you tell it to. Some useful Watch expressionsHere some watch expressions that I’ve used in the past that I’ve found useful:
You can remove an expression from the Watch window by highlighting it and pressing the DELETE key; alternatively you can use the context menu:
Select “Delete Watch” to remove the expression. You can use “Insert Watch” to place the cursor in the expression entry textbox. From there, your new expression is appended to the list of expressions (not inserted at the highlighted row, as you might expect!) Frankly, I never use these context menu options. Fixed in 6.0: String display quirksThe Locals and Watch windows had some quirks in previous versions of Visual FoxPro when it came to displaying strings with non-printable characters in them:
     cMemo = "This is a multiline" + chr(13)+chr(10) + "memo string"
     cBin  = "chr 0 here ->" + chr(0) + "<-"
The windows used to truncate the display of these strings at the chr(0) or char(13). In Visual FoxPro 6.0, they display correctly:
Here we can see that a placeholder of vertical bar characters are used for the CRLF. The Call Stack windowThe Call Stack window can be displayed by selecting “Call Stack” from the Tools menu; by ACTIVATE WINDOW CALL; or, if the Debug toolbar is visible, by pressing the Call Stack checkbutton:
The Call Stack window shows – unsurprisingly – the current procedure/method call stack. Here are two views of the Call Stack window:
The one on the left is what appears when you are stepping through a program: here we are in the GetText() procedure of a program called DEBUGME.PRG. The one on the right is what you get when your program is not yet running, or CANCEL’ed. The message shown here seems a little erroneous, because in actual fact, SET TRBETWEEN is OFF in both cases, yet the call stack is clearly available. It makes more sense (but not much) when you RESUME your program. If “trace between breaks” is off, then your program runs but instead of seeing the call stack dynamically changing, you get the message shown above on the right. SET TRBETWEEN ON and your program runs a lot slower, but you get to see the call stack change as your program runs. TIP: If you are currently suspended, and the Trace window happes to be open as well, then selecting different rows in the Call Stack window will update the Trace window to show the code from the selected procedure/method. This is most useful for cases where, based on information you have just received from the current trace, you want to look back through the call stack and set a new breakpoint against a line of code a procedure level or two below the current line, before resuming. The right-click menu of the Call Stack window has three context-specific items: Ordinal Position; Current Procedure; and Call Stack Indicator.
This picture shows an example where we have suspended 7 levels deep into an application’s initialization routine. The ordinal position indicator is the column of numbers showing how deep we are. The current procedure is indicated by the yellow arrow, and the selected procedure level (showing in the Trace window, if it is visible) indicated by the black triangle. I didn’t even know that the Call Stack window had an “ordinal position” display before investigating it for these notes, so I can’t give you a real-life example of when you’d find it useful. The Debug Output windowThe Debug Output window can be displayed by selecting “Output” from the Tools menu; by ACTIVATE WINDOW ‘debug output’; or, if the Debug toolbar is visible, by pressing the Debug Output checkbutton:
The Debug Output window is used to display debugging messages, both those that are generated by FoxPro, and those that you generate yourself in your programs using the DEBUGOUT command. You can use Debug Output as though it were a kind of persistent WAIT WINDOW:
Unlike the WAIT WINDOW command, you can echo any expression you like using DEBUGOUT. A poor man’s profilerPrior to the excellent Profiler tool in VFP 6, we could profile our code by adding a simple statement to the beginning of each procedure or method:
     #IF _DEBUG = .T.
          DEBUGOUT TIME(1) + " " + SYS(16)
     #ENDIF
The performance hit of DEBUGOUT is negligible in runtime, or when the Debug Output window is not visible, but for those performance fanatics out there, you can always bracket the code as shown, using a #define to create a special “debug” build. The results of including such code in a procedure can be seen below:
Having collected the timing information, you can use the Save As.. option on the right-click context menu to save the contents of the Debug Output window to a text file for further processing. Then Clear the window for the next run. In addition to collecting the results from DEBUGOUT statements, the Debug Output window can have other forms of output directed to it, such as the results of… Event TrackingWhat do you do if you have a problem with code in an object’s methods appearing to interfere with each other, or run out of sequence? Maybe you suspect that you have put code in the wrong method? Rather than laboriously coding DEBUGOUT statements into every method and event in your classes, you can use the Event Tracking feature of the Debugger to show you which events are occuring and in what order.
You can start event logging by clicking on the Toggle Event Logging button on the Debug Toolbar. This displays the Event Tracking dialog:
From here you can decide which events to track, and where to direct the event log. By default, it goes to our friend the Debug Output window, but you can direct it straight to a file. Let’s have a look at the results:
TIP: Each event is prefixed with its object and full containership details. This is one case where you can see that it really pays to give your objects meaningful names, rather than leaving them at there default Text1, or Form1. TIP: Unless you really need it, do not track the MouseMove event. There tend to be a whole lot of them. Coverage Logging
When you press the Coverage button on the Debugger toolbar, the following dialog appears:
This dialog allows you to specify a file to log coverage information to, and whether FoxPro should append to the file if it exists, or replace it. Coverage Logging is a subject for an article in itself, and I won’t say any more about it here. See “Where to go from here?” below. Debugger OptionsWe briefly encountered the Debug page of the Tools:Options dialog earlier. Here, you can set the font, background and foreground colors of different types of text in each of the Debug windows, making it easy to see which window is which. If you press the Set as Default button on the Tools:Options dialog, then all the changes made in this dialog will persist to your next Visual FoxPro session. In addition to these cosmetic settings, there are some important configuration items that are not able to be set anywhere else:
At this point, let’s set the environment to the Debug Frame and see how that affects our debugging process. Using the Debug FrameWhen you switch to using the Debug Frame, all the Debugger windows appear in a separate window frame, floating in the Windows desktop. This window has its own menu, which includes the window specific items from each Debug window context menu, along with a few more specific to the Debug frame. Using the Debug Frame restricts unwanted interaction between the Debug windows and the windows of your application. If the FoxPro frame is invisible – as it often is with top-form based applications – then obviously you must use the Debug Frame in order to view the Debug windows. Using the Debug Frame allows you to use the keyboard shortcuts to activate the various windows and code stepping controls. This is because the Debug Frame has its own menu, with associated hotkeys. The Debug Frame MenuThe Debug Frame has its own menu, which along with echoing the toolbar commands, includes additional items that are not available elsewhere: Save & Load Debugger configurationSelecting Save Configuration.. from the Debug File menu prompts your for a file name with a .dbg extension. These files contain the current settings that you have entered, including watch expressions, breakpoints, and other settings from the breakpoint dialog and event tracking dialog. You can restore these settings at any time by selecting Load Configuration.. from the Debug File menu. Stop and FixBy selecting Fix from the Debug Debug menu, you can get FoxPro to cancel the program and automatically open the source code for editing, with the current line highlighted. Debugger Preference PersistanceThe following settings are stored in the FoxPro resource file:
This means that if you SET RESOURCE OFF, changes you make to the layout, etc, are not saved if you close the Debug window. You may or may not know that all of the configuration settings in the main FoxPro Tools:Options dialog are saved in the Windows registry. This includes the settings on the Debug page like debug font size and colors, and environment settings:
Some Interesting Debugging ProblemsIf we have time in the session I will try and demonstrate some interesting problems, including:
Where to go from hereI could go on… but some of these topics deserve a more in depth look than I have space to cover here. If you are still hungry for debugging tools, take some time to check out the Coverage Profiler; and look up the use of the ASSERT command. Finally…One thing I love about doing sessions about FoxPro is that I almost always end up learning something new about the product that I didn’t know before I started preparing. The Debugger in particular is so comprehensive that I have probably missed some important features out. If you find something interesting in the VFP Debugger that I haven’t covered, I would welcome hearing from you – you can write to me at colin at spacefold dot com. |